Basic interferometry
The interference technique enables you to measure differences in orders of half a wave length of the light used by just counting fringes! and a bit of simple math.
These fringes are the result of constructive and destructive interference patterns created when wavelengths having the same frequency but a phase difference are superimposed
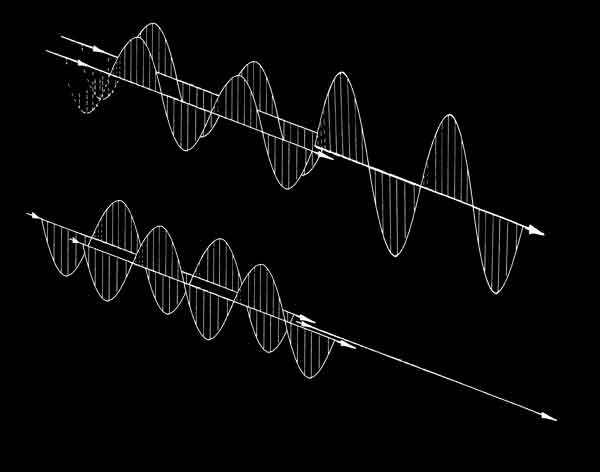
This technique of superposition of two or more waves to obtain information has found wide application in Metrology Seismology, Oceanography, Astronomy in fact any sphere where you are dealing with waves. The equipment we use to cause interference of the waves is called a Interference meter or Interferometer.
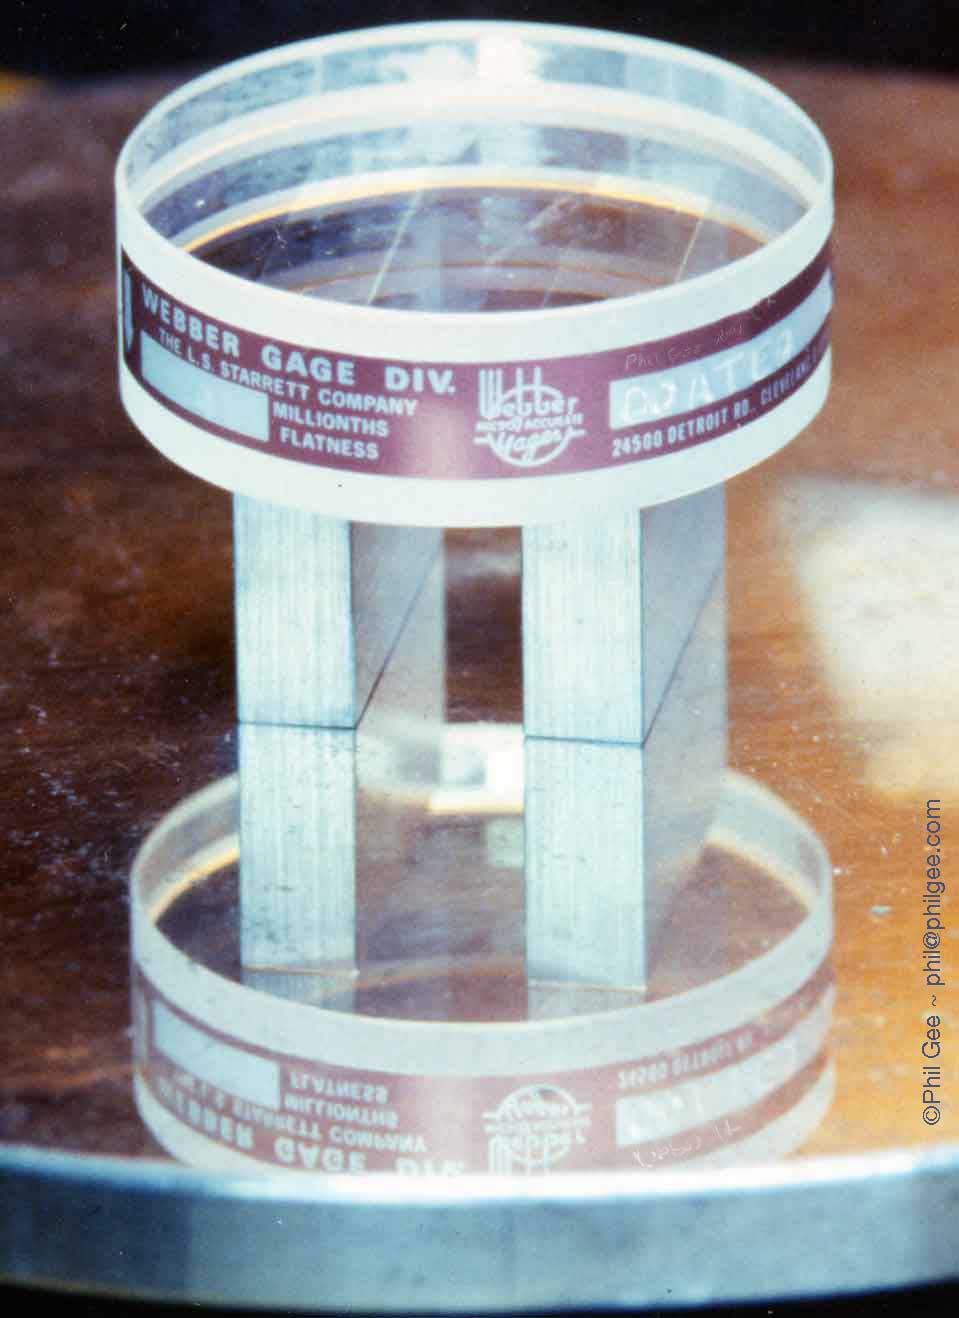
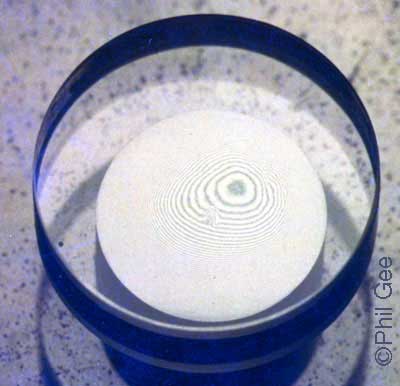
In its simplest form it uses a Optical Flat and a monochromatic light source (waves are correlated and coherent there being only one source and wavelength [frequency] involved) as shown in the first photograph.
Optical Flats and Slip Gauges
Basic interferometer
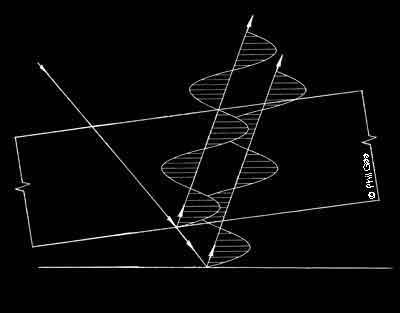
As light travels through the Optical Flat the ray is 'split' into two rays one is reflected internally off the inner bottom surface and the other continuing through the air gap to be reflected off the specimen surface.
The extra distance this ray has to travel before being reflected back will cause a phase displacement; if it is out of phase by 180˚so when it's at maximum the internally reflected is minimum they will destructively interfere and no light will be seen resulting in a dark fringe; every time the gap changes by a multiple of this distance a dark fringe will be the result.
1.
|
2.  |
|
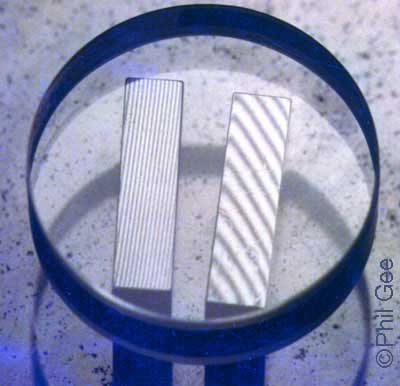
The two Slip Gages above are of notionally the same length, both show a series of fringes indicating there is a variation in height in the direction at right angles to the fringes
|
Monochromatic Light Source used typically a Mercury vapor lamp
Hg yellow wave length 577.0 - 579.0 nm (nm 10 ^-9 or 0.000 000 001) say 578 nm
1 fringe = variation of say 578.0 nm = 0.000 000 578 x 12 fringes = 0.000 006 936 m
A total variation of = 6.936 µm (micron) (x 10 ^-6)
Dynamic interferometry using a Laser and holographic reference
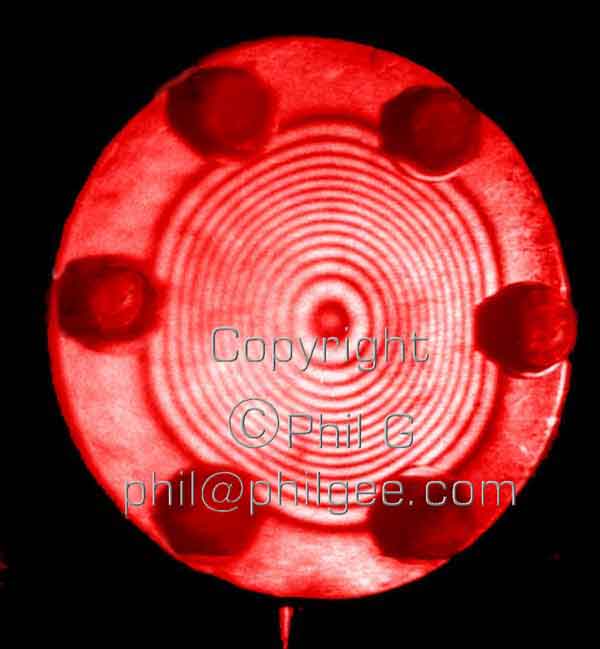
interference fringes show degree and morphology of distortion of pressure plate
Ref:
Newton's Rings
Robert Hooke - his 1664 book Micrographia
Further reading:
Michelson Interferometer
Imaging Interferometry - Fourier analysis -
Aperture Synthesis - Synthetic Aperture Radar (SAR) - Synthetic Aperture Sonar (SAS)
Astronomical Interferometry - VLBI
Just how big is this ? well as a guide
1 µm resolution limit of conventional Photolithography ( microchip fabrication)
1-10 µm diameter of bacterium
3-4 µm yeast cell
6 µm pixel size Hasselblad H3DII-50 SLR 6132 x 8176 pixels (36.8 x 49.1mm) density 166.5px/mm
7 µm spiders web filament
6-8 µm human red blood cell
17 -180 µm (micron) diameter of human hair
25.4 µm - 1/1000th of an inch or 1 thou
100 µm - 1/10th mm
1inch = 25.4 mm ~ width of human thumb
Electromagnetic spectrum Wave lengths of
Micro Waves (WiFi) 2.8 x 10^-2 m
visible light Red ~7x10^-7
Mercury vapor lamp Hg yellow 577.0 - 579.0 nm (nm 10 ^-9 or 0.000 000 001)
Ultra Violet ~ 4x 10^-7
X=ray ~ 1 x10^-9
Gamma ~ 1x 10^-12
Work In Progress
http://www.unc.edu/~rowlett/units/index.html